Accurately predicting demand for products allows a company to stay ahead of the market. We will predict demand for multiple products across a region of a state in the US. Then we will roll up these predictions across many different regions of the same state to form a complete hierarchical forecasting system. We need to forecast the future values of our data. The best part about time series models is to use information from the past to forecast the future. If we know the pattern on how an observation at one time period is related to an observation at another time period, then we can recursively forecast the future using this pattern. What time series are doing is essentially finding th pattern or the signal in our data, and it extrapolate this signal repeatedly over time, namely forecasting. Of course, we have signal but also noise. The remaining noise is what helps us to estimate confidence intervals around oyr forecast.

There are lots of ways of measuring accuracy in time series models. The common measures are the followiong:
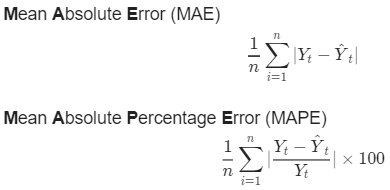
The Mean Absolute Error MAE is the avverage measure of how far away our prediction is from the actual value, in absolute term. So, it predicts at the same scale of our data. The downside is there is not a reference, and the prediction error might be out of place. To solve this problem we use the Mean Absolute Percentage Error MAPE that is the average measure of how far away in absolute percentage term, our prediction is from the actual value. Thsi makes our prediction not depending on the scale of our data.
COMPONENT OF DEMAND Economic theory has a lot to say about predicting values of demand. Obviously, external factors like price, seasonality, and timing of promotions will drive some aspects of product demand. Here, we will learn about the basics around Price Elasticity Models PED and how to incorporate seasonality and promotion timing factors into our product demand forecasts. When we try to predict demand for a product there are many factors that influence demand. The most obvious factor is Price and how price effects demand is referred to Price Elasticity. In the economic Price Elasticity measures how much demand reacts to changes in price.

How much demand changes with changes in price derermines whether a product is called Elastic or Inelastic. Elastic goods are ones where demand changes are larger than the price changes in terms of percentage. Elastic products have % changes in demand larger than the % change in price (Price Elasticity > 1). Bread is an example of this. On the contrary, Inelastic goods are ones that have % changes in demand smaller than the % change in price (Price Elasticity < 1). Gasoline is an example of this. We don’t stop buying gasolie because the price increaced. Unit Elastic is when products have % changes in demand equal to the % of price (Price Elasticity = 1). For example, if bread increased price by 10% and demand also dropped 10% in response. How can we estimate Elasticity for products? Typically we can use linear regression to estimate this relationship between price and demand.
Rice is not the only factor that is invelved on demand changing, but it is also influenced by Season, Holiday, or Promotion. We can plot the time series of Sales and look at the similarity of the time series of Price. To do that, we can again use regression or a more sophistiated approch called Dynamic Time Warping DTW able to measures similarity between two sequences.
BOTTOM-UP HIERARCHICAL FORECASTING This can be used when different items that need to be forecased can be arranged in a ogical hierarchy. There are three types of hierarchical forecasting: Bottom-up Forecasting: we forecast every product, then we reconcile our forecast up. Top-down Forecasting: we forecast the top of the hierarchy and reconcile our forecast down. Middle-out Forecasting: we forecast a middle layer of hierarchy and reconcile our forecast both up and down.
Bottom-up Forecasting means for example we need to forecast our high value product sales and low value product sales, then add them together. This method is easy to implement, but time consuming.
In Top-down Forecasting there are two techinques to reconcile our forecast, one is the Average of Historical Proportions and the other is Proportioon of historical Averages.
The Middle-out Forecasting is the blend between both bottom-up and top-down forecasting. Typically, we pick a middle layer of the hierarchy and forecast that layer. From that layer we performe top-down forecasting for every layer below that and bottom-up forecast fot every layer above that.