In the analytics market Spark is taking off for ETL and Machine Learning. Azure Databircks is a managed version of Spark and very quickly a data scientst is able to start from zero and get to insights. Moreover, in addition it is intereget with Azure AD in order to use the same authentication model that is used for every other services of Azure. A very interesting topic is the integration of RStudio with Azure Databricks and Spark. Spark allows to write code in Python, Java, Scala and R and to sclae it out to a cluster form factor. More precisely, a data scientist can take the code and run it on many machines in order to be able to analyze a big data set. Tipically, in Azure Databricks we starts with norebooks and we attach it to a cluster node, and the code run on these clusters.

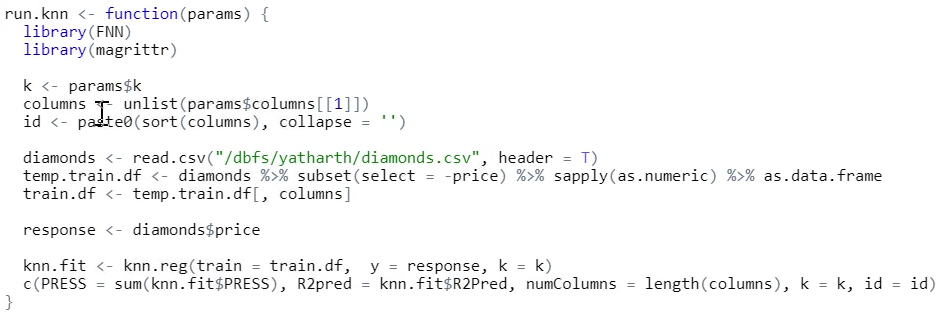
As we can see from the figure above, when we have a cluster we can click on it and we have an Apps on the top menu where RStudio is available with that cluster. This is a online version of RStudio connected to the Spark cluster. In the example below the diamonts data set is used. The goal is to use the KNN algorithm to figure out what is the most optimized version of parameter tuning in orer to predict price. K-Nearest Neighbors K-NN is an algorithm based on feature similarity. It is a non-linear classifier. It identifies the k nearest neighbors of a class that we want to estimate in its class. If we have k=3, the algorithm has to find the 3 nearest neighbors of the class. Choosing the right value of k is a process called parameter tuning, and is important to better accuracy. If the number of k is too low the bias is too small and we have a lot of noise. On the contrary, if the k is too big, then the process of estimation is too long. The solution is to use the square root of n where n is the total number of observations.

The function reported above just takes two parameters (number of neighbors and number of columns) and it fits the model. The code here below is a grid search in order to make all the possible permutations of both K and columns, using K from 1 to 15 and we have 9 columns. There are 7665 permetations of these values.

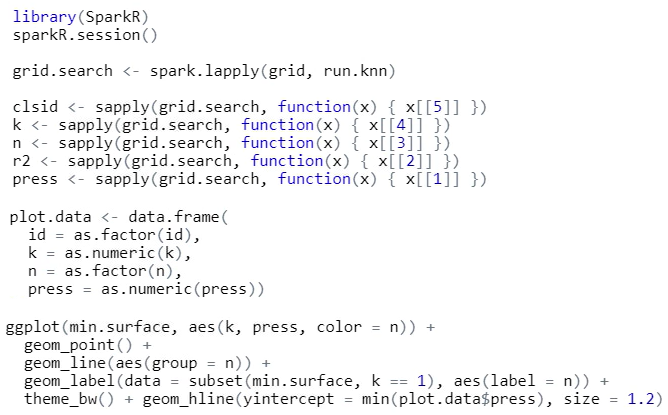
We can now leverage the power of Spark using applied to the R code described above. The aim now is to have the error rate of all the 7665 permutation of the parameters to have which combination perform the better. That is impossible to obtain using a single machine. Here below is described the Spark session inside RStudio to obtain the graphical representation of the errors.

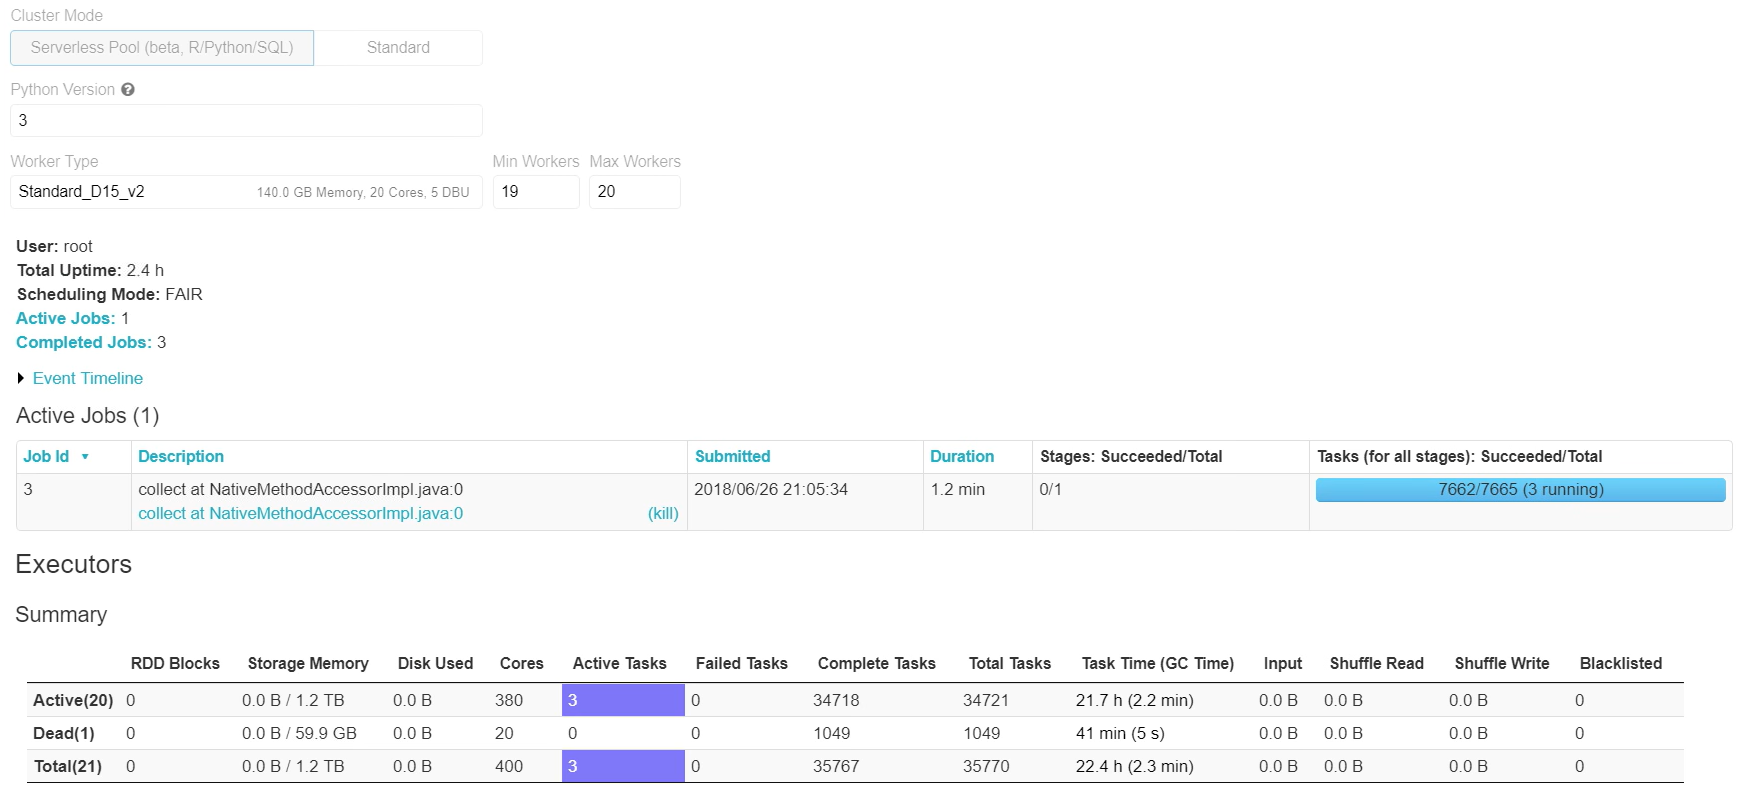
The spark session representet by the code above is able to run all the 7665 permutation on the cluster nodes. We create 20 nodes cluster. Here below is shown the Azure Databricks enviroment that allow us to control the running computetions.

From the figure above, we can see that we have 20 nodes (Max Workers) and there are 381 jobs running in parallel with a Virtual Machine of 20 Cores. It is like to have a data center at our office. In a locacl machine we probably have 8 cores. Moreover, we have real data ready to use on the cloud where the data already resides. We have one unique enviroment where all of our data resides. So, data preprocessing and data stream processing tasks are in the same pipeline in the Azure Databicks environment.
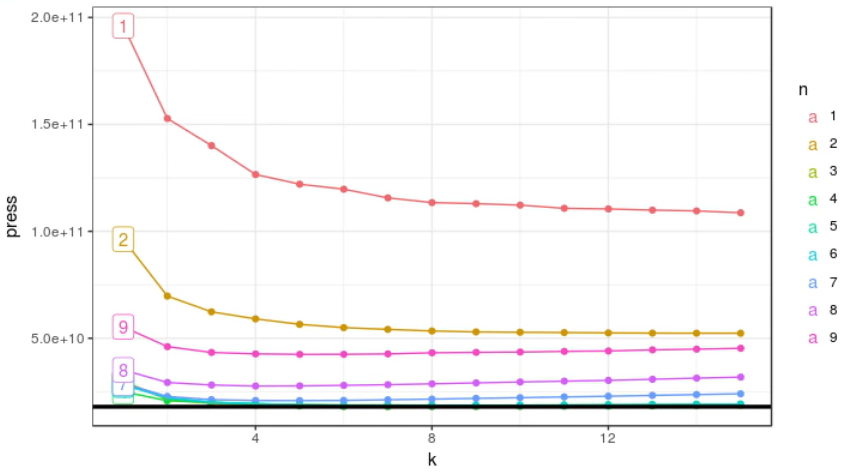
We can see that we have three jobs still running. Once there jons are completed we can see results inside RStudio using ggplot that represent the plot of the error rate for all the permutations. Here below the resulting graph.

On the x-axis we have the number of k considered from 1 to 15, and n is the number of columns. We can see a trend: 1 - the more columns we have, the lower is the error rate. Having 6, 7 or 8 columns or even lower number of columns (independent variables) probably reduce the error rate. 2 - increasing k the error rate goes down, but at a certain point it start to incease again.
We started with no hypothesis about the factors that are governing the price (responce variables) and we were able to create a certain model and execute it against a large data set in Azure Databricks and we were able to find the optimal number k and columns. We can also find which are the columns (independent variables) that coverning the price.