Oversampling and undersampling in data analysis are techniques used to adjust the class distribution of a data set. Both oversampling and undersampling involve introducing a bias to select more samples from one class than from another, to compensate for an imbalance that is either already present in the data. Data Imbalance can be of the following types: Under-representation of a class in one or more important predictor variables. Under-representation of one class in the outcome (dependent) variable.
The end result of over/under sampling is the creation of a balanced dataset. Many machine-learning techniques and neural networks, make more reliable predictions from being trained with balanced data. Certain analytical methods, however, notably linear regression and logistic regression, do not benefit from a balancing approach.
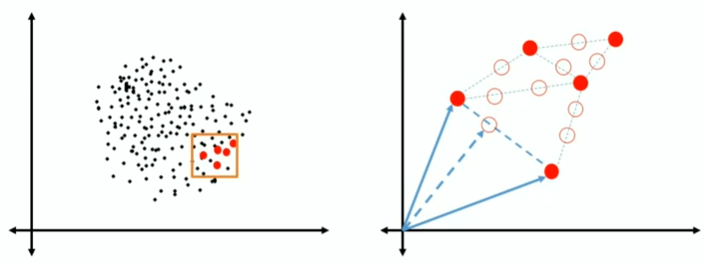
There are a number of methods available to oversample a dataset used in a typical classification problem. The most common technique is known as SMOTE: Synthetic Minority Over-sampling Technique. It creates new synthetic observations. To do that, it identify the feature vector and its nearest neighbour. Then, it take the difference between the two. Crucially, it multiplies the difference with a random number between 0 and 1. We then plot a new data point on the difference line. The feature vector for this new point is our synthetic datapoint.
If we try to identify, for example, fraudolent credit card transactions, we want them in a sufficient number of samples, but a good system do not have more than 5% or 10% of fraud as explained on the right part of the figure above. The complications of the so called Class Umbalance Problem are: Bias Predictions and Misleading Accuracy. In this example, even if we classify all the transactions as non-fraudolent, we will be 95% accurate, but our model does not help despite it gives a very high accuracy.
Another important aspect to take into consideration is a problem that may occur during Validation, that is the Inconsistency of the data. For example, in fraud prevention we cannot split data between January and February because in January people spend more money than February because the Christmas time.
Other examples are: manufacturing defects, rare diseases diagnosis and natural disaster.